| | | |
 Uploading .... Uploading ....Overview Simple score for any given test are not very helpful. On any given day the performance of a student in any academic test can be impacted by number of factors. To name a few: knowledge of content, confidence, test taking strategies, stamina, distraction etc.
Socrato’s learning analytics is designed to look for various factors that can impact the learning and scores. The Diagnostic reports provide quantifiable impact and points lost by various categories. This tangible, actionable and granular feedback enables user to create a most optimal study plan, and focus on areas that need most attention.
What is Covered Socrato Individual Student Diagnostic Reports are organized to provide - Big Picture, learning history and trends
- The section provides the history or past 6 practice results and high level trends in score for various subjects and categories.
- Points cost analysis by skills analysis and impact
- Skills area is what the examination organization are looking for. Socrato is able to provide you detailed point cost impact analysis for each of those.
- Subject Area / Learning Standards, Strands analysis
- Study plans are typically organized by the chapter / topics of book or study material. Socrato analysis is able to pin point the exact area where student need to focus
- Test Taking Tendencies Analysis
- There are number of factors that impacts the score in a test. Socrato report analyzes guess factor, tiered ness / fatigue factor and also tracks confidence factor etc.
Socrato Individual Student Diagnostic Report Organization The report is packaged in a PDF format, including an overview of performance over time, followed by current Test performance, followed by section by section performance. For full length big test like SAT and ACT the report is about 5 – 6 pages long. For section test the report is about 2 pages long. For business this report can be branded with their organization logo and contact information.
Graphs in Socrato Individual Reports Please note – Not all graphs are available in all reports.
Big Picture- Performance Summary & Practice Summary
List of up to 5 past practice sessions completed by the student for the exam.
Points to Perfect : The point gap between a student’s Earned Scaled Score for the latest test
Big Picture- Performance Summary & Practice Summary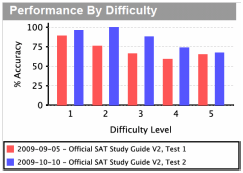
Percentage of questions answered correctly, for each difficulty level across the entire test.
This graph will show the data for the last 5 practice sessions.
Big Picture- Confidence History 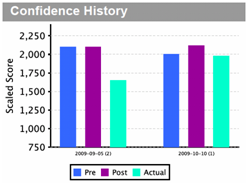
This graph provides insight into students self confidence, understanding and assessment about their preparedness. This compares 3 data elements for each practice session.
- Pre-Test Confidence Score – Anticipated net score by student before they started the test practice session
- Post-Test Confidence Score – Anticipated net score after student has completed the test but has not yet reviewed the actual results
- Actual Score – Actual score received by student.
This graph will show the data for the last 5 practice sessions.
Current Test Analysis – Points Cost By Skills Area 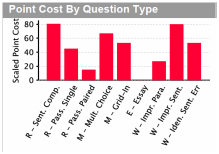
A quick way to understand where points are being lost with reference to the perfect scaled score in
each subject area and skills area / question type. It shows the actual points lost.
Current Test Analysis – Performance By Skills Area / Question Types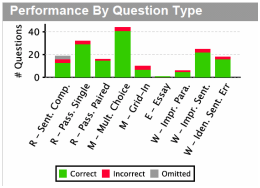
A quick way to understand what’s happening in each subject area in terms of correct, incorrect and omitted. The incorrect and omitted will contribute towards the points lost. The graph shows a count of the number of questions and combines the count for multiple sections for same subject. For the SAT it combine the scores for reading, writing, and math sections
Current Test Analysis – Performance Over Time / Fatigue Factor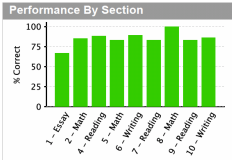
Analysis to see whether a student is getting tired over time, and if fatigue is causing the score
drop. The graph shows the percentage correct for each section on the time (section) scale.
Current Test Results Analysis – Answer Distribution 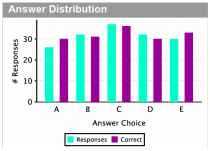
Analysis to see if the student is guessing and choices. This graph compares the number of expected responses for each answer choice versus the actual count of the responses the student has provided.
Current Test Results Analysis – Subject Area & Question Type Analysis 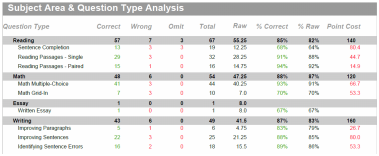
Summary analysis by subject area and by question types in each subject area. Each subject area analysis includes the data for all sections in that subject area.
This detailed analysis and insight provided in this table are:
Question Type – See the details for abbreviation in “Abbreviations” section
Correct – Number of correct responses
Wrong – Number of incorrect responses
Omit – Number of questions omitted
Total – Total number of questions by question types
Raw – Raw points is sum of point for correct response minus (if applicable) points for incorrect responses. (Not all tests has negative marking. SAT as negative marking, where ACT do not have penalty for incorrect responses)
Percentage correct – Total for the line / # of correct * 100
Percentage Raw – Total for the line / raw points
Point Cost – Total points lost for each question type or section (shown in each corresponding line)
Current Test Analysis – Performance by Topics / Subject Breakdown 
This graph shows performance by subject area. Within each subject area there are subtopics. This graph performs the analysis for each of the topics and subtopics, and helps pin point the specific areas of focus. The count for a topic summarizes (and includes) the count of responses for all subtopics of that topic.
Current Test Analysis – Responses 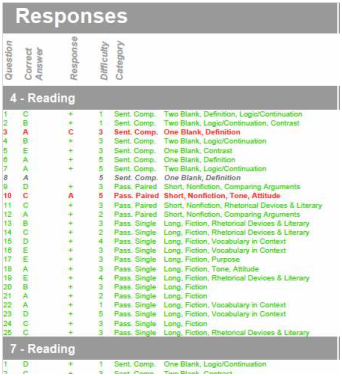
List of all questions responses for a given subject area. It lists all sections associated with the subject area to provide a holistic view of performance. This list helps to identify other factors such as:
(a) if more questions are wrong towards the end of the section,
(b) was there a block of questions that were wrong due to a shift in attention etc.
This list shows, section#, question#, correct answer, if wrong user answer choice or + for correct response, difficulty of question and question type category
|
|
|
| | | |
|